Ficus Carbon station · Claude Code

What your Claude Code habit costs the atmosphere

Ficus reads the token counts Claude Code already writes to disk, turns them into electricity, water and CO2e using published factors, and prices the carbon at what verified removal actually sells for. It runs entirely on your machine, and it shows every constant and every formula it used.

View the example dashboard → Source on GitHub The example is fabricated data, rendered by the real code.

Estimate No vendor publishes per-query energy for a hosted model. Every figure here is an order-of-magnitude estimate — treat it as ±50%. Trends over time are meaningful; the absolute numbers are indicative.

Getting started

Install

Four steps. Nothing is installed system-wide, nothing phones home, and every file it writes lives under your Claude config directory.

Before you start

  • bash, sqlite3 (3.41+ for receipt downloads) and jq — all present on a current macOS or Linux box.
  • Claude Code, with a config directory at ~/.claude (or $CLAUDE_CONFIG_DIR).
  • No package manager, no runtime, no daemon. It is shell scripts and one SQLite file.
  1. Clone it

    git clone https://github.com/Magonia-Research/ficus.git
    cd ficus
  2. Create the ledger

    setup.sh creates the SQLite database and writes factors.env, the small constants file the statusline reads.

    bash scripts/setup.sh
  3. Backfill your history

    Claude Code keeps session transcripts on disk. This reads them, deduplicates the token counts and records one row per session — so the ledger starts with everything you have already done rather than from zero.

    bash scripts/backfill.sh
  4. Wire the hooks and the statusline

    A Stop hook records each session as it ends; a SessionStart hook re-runs the safety scan. Add to ~/.claude/settings.json:

    {
      "hooks": {
        "Stop": [{ "hooks": [{ "type": "command",
          "command": "bash /path/to/ficus/scripts/persist-session.sh" }] }],
        "SessionStart": [{ "hooks": [{ "type": "command",
          "command": "bash /path/to/ficus/scripts/safety-rescan.sh" }] }]
      }
    }

    For the live readings in your statusline, either use statusline-snippet.sh as-is or fold it into an existing statusline — docs/statusline-segment.md has the merge recipe. The render path reads two pre-written files and runs one awk; it never touches the database.

What you get

Everything Ficus adds, and where it lives.
CommandWhat it does
/carbonThe footprint report in your terminal — totals, by model family, offset balance.
/carbon-reviewThe same figures with familiar-scale comparisons and the reasoning behind each one.
/carbon-offsetRecords a purchase or donation against a receipt, and exports a tax-year CSV.
generate-dashboard.shBuilds the single-file HTML statement — the one linked at the top of this page.
~/.claude/carbon-ledger/The database, the constants cache, your receipts and exports. Nothing leaves it.
Provenance

Where the data comes from

Two different kinds of input, and it matters which is which: your token counts are measured and come off your own disk, while every factor that turns a token into a gram is published by someone else and carries its citation.

Your usage — measured, local

Claude Code writes a JSONL transcript for every session. Ficus reads the token counts out of those files: input, output, cache-creation and cache-read, per model. Nothing is sampled and nothing is inferred.

  • Deduplicated by message and request id, so a resumed session is not counted twice.
  • Non-Claude models are excluded, not guessed at. A local model behind a custom base URL records zero rather than a fabricated estimate.
  • Never uploaded. The dashboard is a single offline HTML file with no network calls in it at all — the test suite fails the build if a loadable external reference appears.

The factors — published, cited

Per-model emission factors come from Jegham et al. 2025 (arXiv:2505.09598), the most complete public accounting available. Sonnet is fitted to three published per-query energies; Opus, Haiku and Fable are extrapolated from it — so Fable carries a double extrapolation, which is a large part of why the ±50% band exists.

Every result is cross-checked against EcoLogits, an independent peer-reviewed model (JOSS 10.21105/joss.07471). The two methodologies diverge by about 1.05×; the build fails if they ever diverge by more than 3×.

The constants, and who measured them

These are the exact values in data/factors.json as this page was built. Each one carries a _source field naming the publication and the date it was recorded, and this table is generated from that file rather than typed out here.

Physical constants used to derive electricity, water and embodied carbon.
ConstantValueSource
Grid carbon intensity · g/Wh0.287AWS location-based grid carbon intensity 0.287 kgCO2e/kWh = 0.287 g/Wh, Jegham et al. 2025 (arXiv:2505.09598) — the same constant the co2 factors embed, making the identity exact. Recorded 2026-08-06.
Power usage effectiveness (PUE)1.14AWS fleet PUE 1.14, Jegham et al. 2025 / upstream METHODOLOGY.md. Recorded 2026-08-06.
On-site water use · L/kWh0.18AWS on-site WUE 0.18 L/kWh (AWS 2023 sustainability figure, documented in upstream METHODOLOGY.md:42-47); applied to IT energy E/PUE. Recorded 2026-08-06.
Off-site water use · L/kWh5.11US off-site (generation) water intensity 5.11 L/kWh, WRI methodology via Li et al. Making AI Less Thirsty, documented in upstream METHODOLOGY.md:42-47; applied to facility energy. Recorded 2026-08-06.
Embodied carbon · gCO2e/kWh44.1Derived proxy: 8xH100 server embodied = 5700 kgCO2e (p5.48xlarge ex-GPU, BoaviztAPI) + 8 x 273 kgCO2e (H100 80GB, Lees-Perasso et al.) = 7884 kgCO2e over a 3-year life; lifetime energy at full TDP = (8 x 0.7 kW + 1.2 kW) x 26280 h = 178704 kWh; 7884000 / 178704 = 44.1 gCO2e/kWh. Allocation proxies through energy because the DB stores tokens, not GPU-seconds. Caveat: assumes 100% utilization at TDP; lower utilization raises per-kWh embodied. EcoLogits methodology (fetched 2026-08-06).
Cache-read factor0.08Energy of a cache_read token as a fraction of an uncached input token. Engineering estimate (~0.08, defensible range 0.05-0.15) derived from the decode-phase KV re-read residual. NOT Anthropic's 0.1x billing ratio (a price, not energy). See METHODOLOGY.md.
Method

How each figure is calculated

Four numbers, one chain. Carbon is estimated from tokens; everything else is derived from carbon by a fixed published factor — which is why the three lines on the dashboard chart always move together.

1 · Carbon, from tokens

Deduplicated token counts multiplied by per-model factors in grams of CO2e per million tokens. A cache-read token is charged a fraction of a fresh input token, because it skips the prefill:

co2_g = ((input + cache_write) × f_in + cache_read × f_in × 0.08 + output × f_out) / 1e6

Cache-read factor: 0.08. This is the only step that is a model rather than an identity — everything below follows from it arithmetically.

2 · Electricity, by identity

Not a second model. The published CO2e factors are facility energy multiplied by a grid carbon-intensity figure, so dividing by that same figure recovers the energy exactly:

energy_wh = co2_g / 0.287

Grid carbon intensity: 0.287 g/Wh. Because this is an exact identity rather than an independent measurement, electricity is deliberately never given a price on the dashboard — the kilowatt-hours and the carbon are one quantity in two units, and charging for both would bill the same externality twice.

3 · Water, two terms kept PUE-consistent

On-site cooling water applies to IT energy — facility energy divided by PUE — while off-site generation water applies to the full facility energy:

water_ml = energy_wh × (0.18/1.14 + 5.11)

PUE 1.14, on-site WUE 0.18 L/kWh, off-site WUE 5.11 L/kWh. The off-site figure is the largest single source of uncertainty in the whole chain and sits at the high end of published estimates.

4 · Embodied carbon, reported apart

The amortised share of manufacturing the hardware, at 44.1 gCO2e/kWh:

embodied_g = energy_wh × 44.1 / 1000

It is never folded into the operational figure and never enters what you owe. It is a real cost with a different owner, so it gets its own line.

What a dollar is being asked to buy

The balance is priced at $227 per tonne, the retail price of ex-post biochar removal certificates from the vendor this project actually links to. Three rules keep that figure honest:

Water gets a restoration match rather than an offset: water is basin-local and a gallon returned to one stream does not repay a gallon drawn from another. It is a contribution, it is labelled as one, and it never touches the carbon balance.

Full derivations, including every rejected alternative, are in METHODOLOGY.md.

Reading it

What the statusline shows

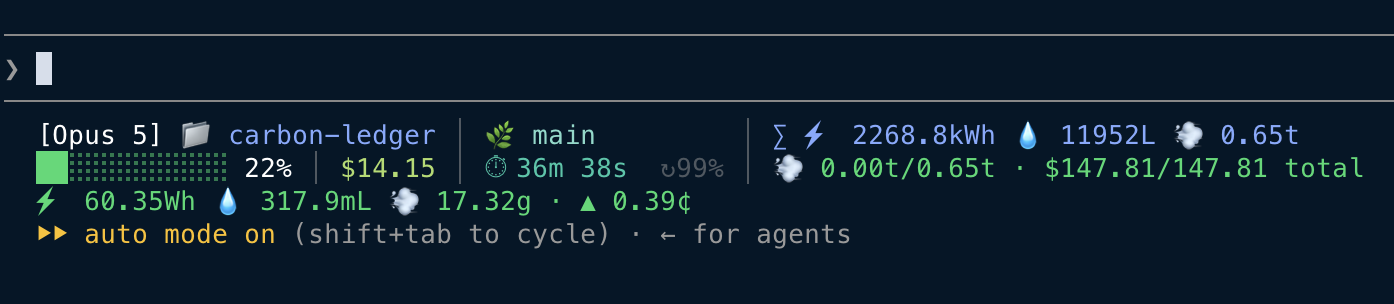
Every figure on the carbon rows, what it counts, and which line of the maths above produced it. The left-hand side is Claude Code's own status JSON and is reproduced here only so the screenshot reads in one piece — this project does not compute it.

A terminal statusline. Top left: the model name Opus 5, a folder icon with the project name carbon-ledger, and a branch icon with main. Second row left: a context-usage bar at 22 percent, a session cost of $14.15, an elapsed time of 36 minutes 38 seconds, and a cache hit rate of 99 percent. A vertical rule separates a right-hand carbon column: all-time totals of 2268.8 kilowatt-hours, 11952 litres and 0.65 tonnes on the first row, and 0.00 tonnes removed of 0.65 tonnes emitted with $147.81 of $147.81 still owed on the second. A full-width row underneath shows this session: 60.35 watt-hours, 317.9 millilitres, 17.32 grams, and an offset cost of 0.39 cents.
The carbon column sits to the right of whatever statusline you already run; the session row sits underneath it, directly above Claude Code's mode line.

The lifetime column, right of the rule

Read out of the ledger database, not recomputed at render time. These are sums over every session ever recorded, which is why they only move when a session ends.

All-time totals and the settlement pair.
ShownWhat it countsHow it is calculated
∑ ⚡ 2268.8kWhEvery watt-hour of datacenter electricity attributed to this account's usage, for all time.Sum of energy_wh across all session rows, each energy_wh = co2_g / 0.287.
💧 11952LCooling and generation water for that electricity, both terms combined.Sum of water_ml, each water_ml = energy_wh × (0.18/1.14 + 5.11).
💨 0.65tOperational CO2e for all time. Embodied carbon is not in this figure.Sum of co2_grams, each co2_g = ((input + cache_write) × f_in + cache_read × f_in × 0.08 + output × f_out) / 1e6.
💨 0.65t/0.65tTonnes still to remove, over total emitted. The left number falls only when a receipt is recorded, and goes negative if you remove more than you emitted.The tonnes total above, minus retired tonnes from the offsets ledger / that same total. Prevention credits never enter this pair.
$147.81/147.81 owedDollars still owed to clear the balance, over what the whole balance would cost. Equal until something is bought, negative once contributions pass carbon-neutral.Unsettled tonnes × $227/t, over emitted tonnes × the same rate.
Both pairs read the same way — what is left, over the whole job — one in tonnes and one in dollars. They move at different times on purpose: only verified removal settles the tonnes, while every offset and donation dollar settles the dollars 1:1.

The session row, underneath

Computed live in the render path from the token counts Claude Code passes on stdin. No database is opened to draw this row — that is a hard budget, because the statusline runs on every keystroke-driven repaint.

This conversation only, recomputed on every repaint.
ShownWhat it countsHow it is calculated
⚡ 60.35WhElectricity for this conversation so far.energy_wh = co2_g / 0.287, at grid intensity 0.287 g/Wh.
💧 317.9mLWater for that electricity, on-site plus off-site.water_ml = energy_wh × (0.18/1.14 + 5.11) — PUE 1.14, WUE 0.18 on-site and 5.11 off-site.
💨 17.32gOperational CO2e for this conversation.Tokens × the per-model factors, co2_g = ((input + cache_write) × f_in + cache_read × f_in × 0.08 + output × f_out) / 1e6.
▲ 0.39¢What removing this session's carbon would cost at the price this project links to.Session grams × $227/t. Shown in cents below a dollar: a whole cent is 44 g, so a dollars-and-cents figure would read $0.00 for the opening stretch of every session and then jump, which is indistinguishable from a figure that has stopped updating.

The session row is the roughest number on the screen, by construction. Claude Code does not break out cache-read tokens in the statusline payload, and parsing the transcript on every repaint would blow the render budget — so this row reads context_window, which is current context size: it counts cache reads as ordinary input and does not see subagent tokens at all. The ledger, the dashboard and every report parse the transcript properly and deduplicate. When the two disagree, the ledger is right.

Not ours

Everything left of the vertical rule comes from Claude Code itself and is shown for context only: the model name, the working directory, the git branch, the context-window bar and its percentage, the elapsed session time, and the cache hit rate. The dollar figure on that side is Claude Code's own session cost — it is a price paid for tokens and has nothing to do with the figure on the carbon row, which is a price to remove carbon. Two dollar signs, two entirely different meanings, which is why they sit on opposite sides of the rule.

Research

Where the money can go, and what those organisations actually do

A shortlist of seven, one per ecosystem, each researched rather than recommended. Every sentence below is generated from data/giving-shortlist.json, which records the research document each claim came from — including the two entries whose honest verdict is that they do not offset anything.

Settles the balance

Verified removal. Carbon already taken out of the atmosphere and retired in your name, so a purchase moves the tonnes figure above.

Remove Carbon Today

Air — removal · biochar CORCs €198 / tonne · ≈ $227

Sells ex-post biochar carbon-removal certificates issued under the Puro Standard: the biochar is independently weighed and sampled, third-party audited, and the certificate is retired in your name on the public registry. Puro does not sell direct, so a reseller is the small-buyer route; the minimum here is 1 kg.

On the price. First-party retail, fetched 2026-08-08: the vendor sells one tonne of ex-post biochar removal at EUR 198 with Puro registry retirement proof, priced as its average CORC acquisition cost plus a 10% operating margin. Converted at the ledger's own dated FX constant (ECB 0.8729 EUR/USD): 198 / 0.8729 = 226.83, stored as 227 in data/offset-constants.json and used for every cost-to-clear figure. This replaces the ≈$160 shown here previously, which was the Nasdaq CORCCHAR wholesale index — what institutions clear at, not a price a small buyer can transact, and below this supplier's own ask. FX-sensitive: it moves with both the CORC market and the euro.

The only pathway on this page that settles the balance above — verified removal, already delivered rather than promised.

Since the research was written. Live durability revision: a 2025 peer-reviewed paper (Petersen & Sanei, GCB Bioenergy) found the H:Corg ratio biochar certification rests on can both under- and over-predict true stability, and field decay rates across six isotope-labelled experiments run from 0.8% to 7.0% a year. Puro responded by downgrading its top durability claim from a de facto millennial framing to a new CORC200+ class — several centuries, not millennia. Biochar still delivered 91% of all durable-removal volume in 2025.

Prevents a future emission

Verified avoidance. Real, third-party audited, and a different accounting category: it stops an emission that would otherwise happen rather than removing one that already did, so it never settles a removal debt.

Tradewater

Air — prevention · refrigerant destruction $15 / tonne, stated

Collects and destroys ozone-depleting refrigerants and plugs orphaned methane wells. Every container is third-party weighed, sampled and lab-analysed, destruction facilities are monitored to better than 99.99% completion, and the credits are certified under ACR or VCS. The research calls this the cleanest additionality story in the cheap tier.

On the price. Not independently confirmed, and plausibly 3–5× off the market. The nearest public comparable — Recoolit, a rival refrigerant-destruction project — sells pilot credits around $75/t. Worth a direct quote before a large purchase.

Avoidance, not removal. It stops a future emission; it does not take carbon back out, so it is recorded below the line and never settles the balance.

Since the research was written. The accounting is tightening around this distinction. SBTi's Corporate Net-Zero Standard V2.0, finalised 11 June 2026, is explicit that reduction and avoidance credits are disallowed for net-zero neutralisation claims — only removal credits qualify — and becomes mandatory for new targets from January 2028.

Fund from a conservation budget

Land, river, wetland and reef work. The research is blunt that most of these cannot be honestly priced per tonne, and that two of them are probably net carbon sources. They are here because they are worth funding — not because they offset anything.

Naturaland Trust

Land & watershed · Blue Ridge escarpment ≈ $20–150 / tonne

Buys and protects escarpment land above Greenville — 1,090 acres at Saluda Bluffs for about $9M, and a 365-acre stretch of the Highway 11 corridor — inside the watershed that feeds Greenville Water's own reservoirs at Table Rock, North Saluda and Poinsett.

On the price. Rough and self-constructed from public data, not a credit. Amortised-flux method: $8,250/acre ÷ (4.78 tCO2e/acre/yr × 40 years) ≈ $43/t, or ≈ $17/t over 100 years. Avoided-conversion stock method: $8,250 ÷ ~83 tCO2e/acre ≈ $100/t, and ≈ $165/t at the Highway 11 asking price. Both are defensible; they differ 5–8× purely by method, and that spread is the honest uncertainty band.

The only non-market organisation here where a number can be built from public data with a paper trail. Additionality is plausible — this land carries genuine $8,000–20,000/acre development pricing — but Naturaland has published no baseline scenario and no leakage assessment, which is what a registry would require.

Since the research was written. The water case is the stronger one. The structural analogue is New York City's Catskill/Delaware programme: about $2.5B spent since 1997 on land buyouts and watershed protection avoided an estimated $6–10B filtration plant plus $250–300M a year to run it. No equivalent engineering study exists for this watershed, so no dollars-per-litre figure can be built — but it is the only organisation on this page whose work protects a municipal drinking-water supply directly.

American Rivers

Rivers · dam removal No purchasable tonne

Dam removal and river restoration. Reservoir surfaces are a large methane source — an estimated 0.8 (0.5–1.2) Pg CO2-eq a year globally, about 1.3% of all human emissions — and a CARB-hosted March 2026 report estimates the four removed Klamath River dams eliminated roughly 275,000 tonnes CO2e a year.

On the price. Illustrative arithmetic only: the Klamath project's $450M total budget ÷ 5.5 Mt cumulative over 20 years ≈ $82/t; ÷ 27.5 Mt over 100 years ≈ $16/t. The horizon choice alone swings it 5×, and no registry standardises it.

The methane avoidance is real and reasonably well quantified for specific dams. A donation still cannot be converted into tonnes: American Rivers is one policy, legal and technical partner among many funders on Klamath, not the payee of the $450M, and it sells no credit. Dam removal also creates a short-term emissions pulse from erosional carbon loss and sediment methane.

Since the research was written. A 2024 BioScience review of river restoration says it in its own title: river restoration can increase carbon storage but is not yet a suitable basis for carbon credits.

Congaree Land Trust

Wetlands & swamp · COWASEE basin No defensible number

Holds conservation easements across 25,398 acres in the COWASEE basin around Congaree National Park — the largest old-growth bottomland hardwood forest in the eastern United States. The easements are overwhelmingly donated rather than bought, so a gift funds legal, stewardship and monitoring work rather than land purchase.

On the price. There is no market transaction to divide the carbon stock by. The stock itself is exceptional: floodplain forested wetlands hold 176.6 ± 84 MgC/ha in the top metre — about 262 tCO2e/acre in soil alone — plus roughly 80–90 tCO2e/acre of old-growth aboveground biomass. That is several times the upland figure, but it is a stock, not a flux.

One of the highest carbon stocks of any protected forest type in North America, genuinely protected, with nothing to price it against. 'No defensible dollars per tonne' is the honest answer here, not a knock on the ecology.

Since the research was written. Open evidence gap: no Congaree-specific methane flux measurement was found. The wetland literature splits by hydrology — permanently inundated freshwater wetlands run high methane, while seasonally inundated types like this one tend to sequester more than they emit — but that is a general finding, not a measurement of this basin.

Billion Oyster Project

Coasts & estuaries · New York Harbor No defensible number

Builds self-sustaining oyster reefs in New York Harbor — about 150 million oysters across 17 acres as of December 2025, at roughly $250,000 an acre — with a public-schools programme attached to the restoration work.

On the price. Filtration is the real benefit and it is genuine: an acre of reef, around 750,000 oysters, can filter 15–40 million gallons a day. But that is cleaning water rather than creating it, and it is saline estuarine water — no bearing on a datacentre's freshwater draw.

Not a carbon investment, and probably a net source. Fodrie et al. 2017 find restored reefs can bury organic carbon at rates comparable to mangroves and marshes, but on exposed sandflats — much of this footprint — inorganic carbon burial vents more CO2 than the organic burial takes down, leaving them slight net sources at about 0.5 ± 0.3 MgC per hectare per year. The result holds across a 100–4,000 year sediment-core dataset, so it is not a transient artefact.

Since the research was written. Nitrogen cuts both ways too: the reefs remove reactive nitrogen through denitrification, a real water-quality benefit, but preliminary reef-scale work found nitrous-oxide production high enough that the researchers explicitly called for reevaluating the climate benefit of oyster-reef restoration. No BOP-specific carbon accounting exists in any BOP publication.

Coral Restoration Foundation

Oceans · Florida Keys No defensible number

Propagates and outplants staghorn coral in the Florida Keys. One empirical Florida study found that CRF-style high-density Acropora cervicornis outplanting restores positive net carbonate accretion on reefs that had gone net-erosional — that is reef structure rebuilt, not atmospheric carbon removed.

On the price. Florida's reefs carry a documented $1.8B flood-protection value, and the tourism and biodiversity case is strong. None of that converts into tonnes.

No carbon benefit, defensible or otherwise. Net calcification lowers seawater alkalinity faster than dissolved inorganic carbon, producing a net CO2 flux to the atmosphere, and a search specifically for a CRF carbon claim found none at all — not even a marketing-level one. Fund it for the reef, the coastline and the biodiversity.

Since the research was written. The direction of travel is counterintuitive: a 2025 PNAS study projects that the decline of coral calcification under warming and acidification will modestly increase ocean carbon uptake — up to 0.48 GtCO2 a year, median, by midcentury. That is the opposite of what a restoration donor might hope, and it is another reason to fund this for the reef rather than the ledger.
Ficus takes no cut and has no affiliate relationship with any organisation on this page. The links are plain links. Nothing is bundled, nothing is resold, and the tool never initiates a payment — you buy directly from the organisation and then record the receipt yourself.

See it

The example dashboard

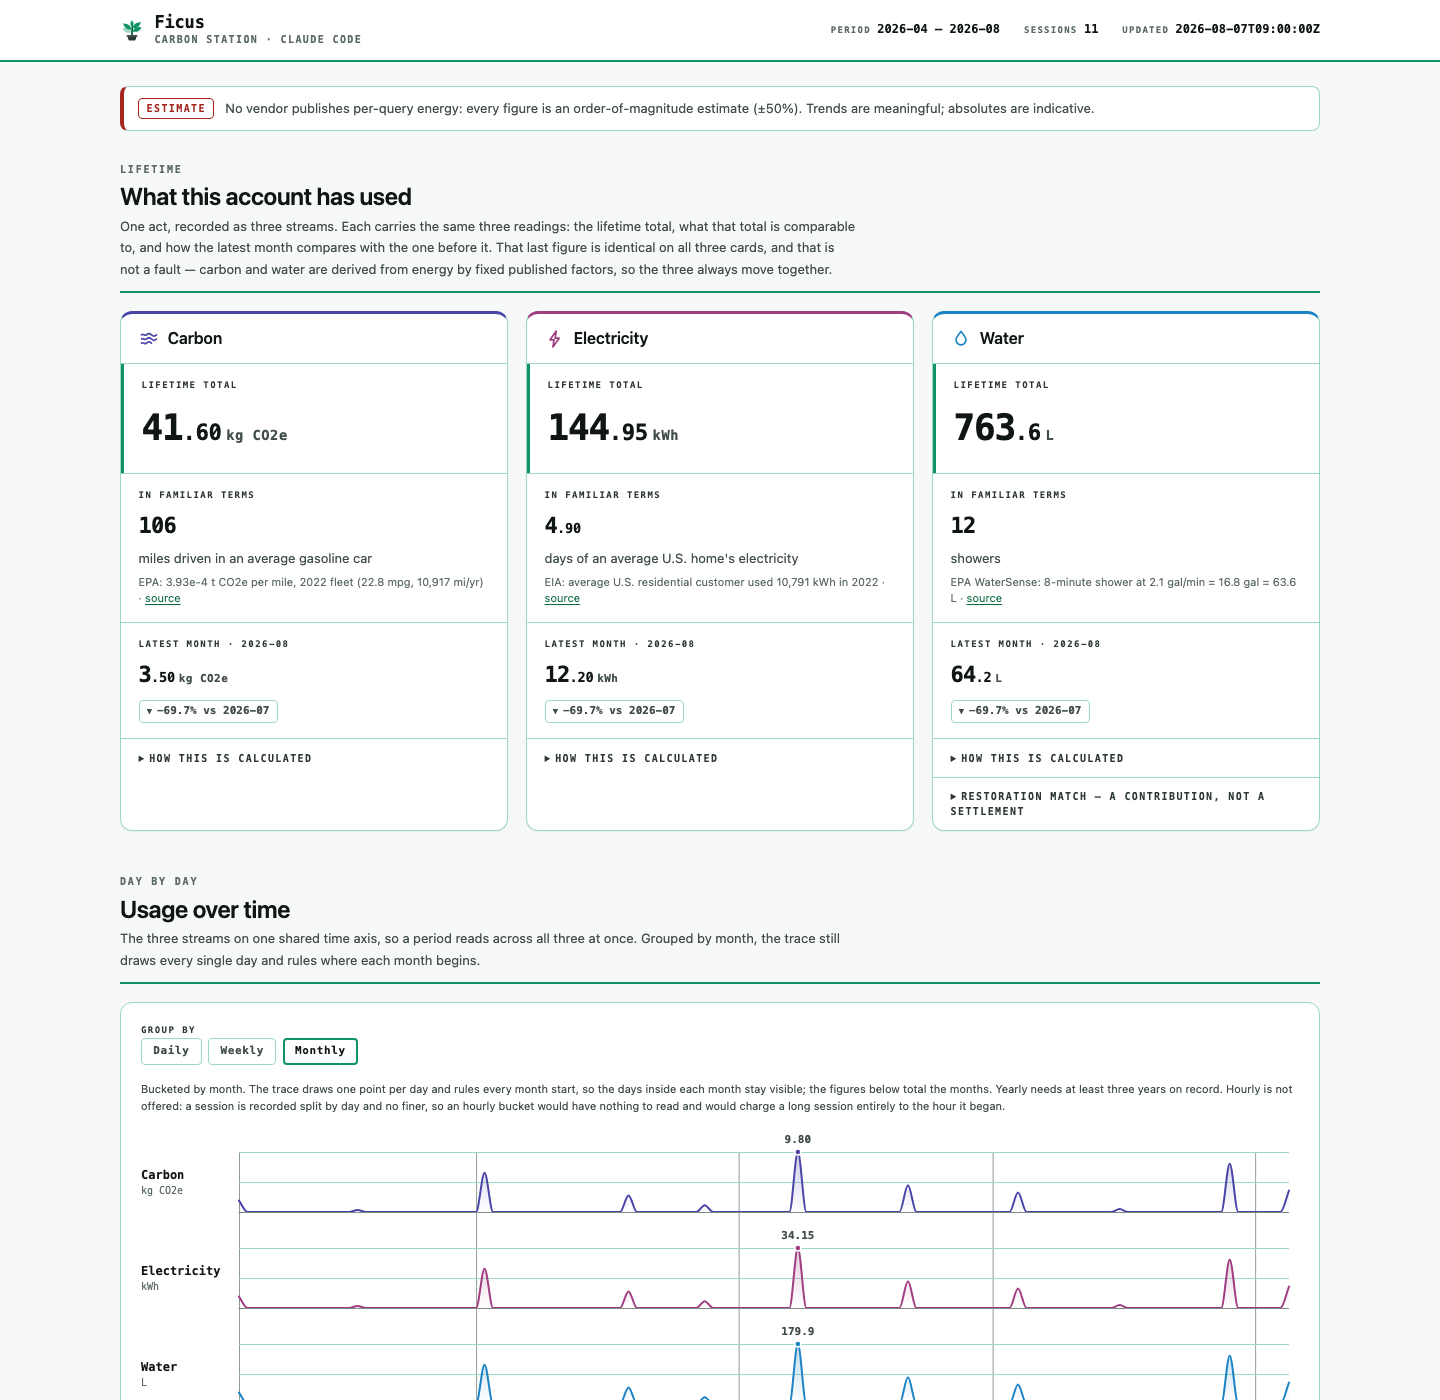
A complete statement rendered by the real generator from fabricated data: five months of invented sessions, two invented purchases and one invented donation. Everything you would see on your own, with none of anyone's actual usage in it.

Open the example dashboard → One HTML file, no network calls. Save it and it still works.
The Ficus dashboard: lifetime carbon, electricity and water totals across three cards, above a three-lane time-series chart of daily usage grouped by month.
The dashboard groups usage by month but draws every individual day, ruling each month boundary — a month total hides whether it came from one heavy Tuesday or thirty steady ones.